
Mobility & Urban Analytics
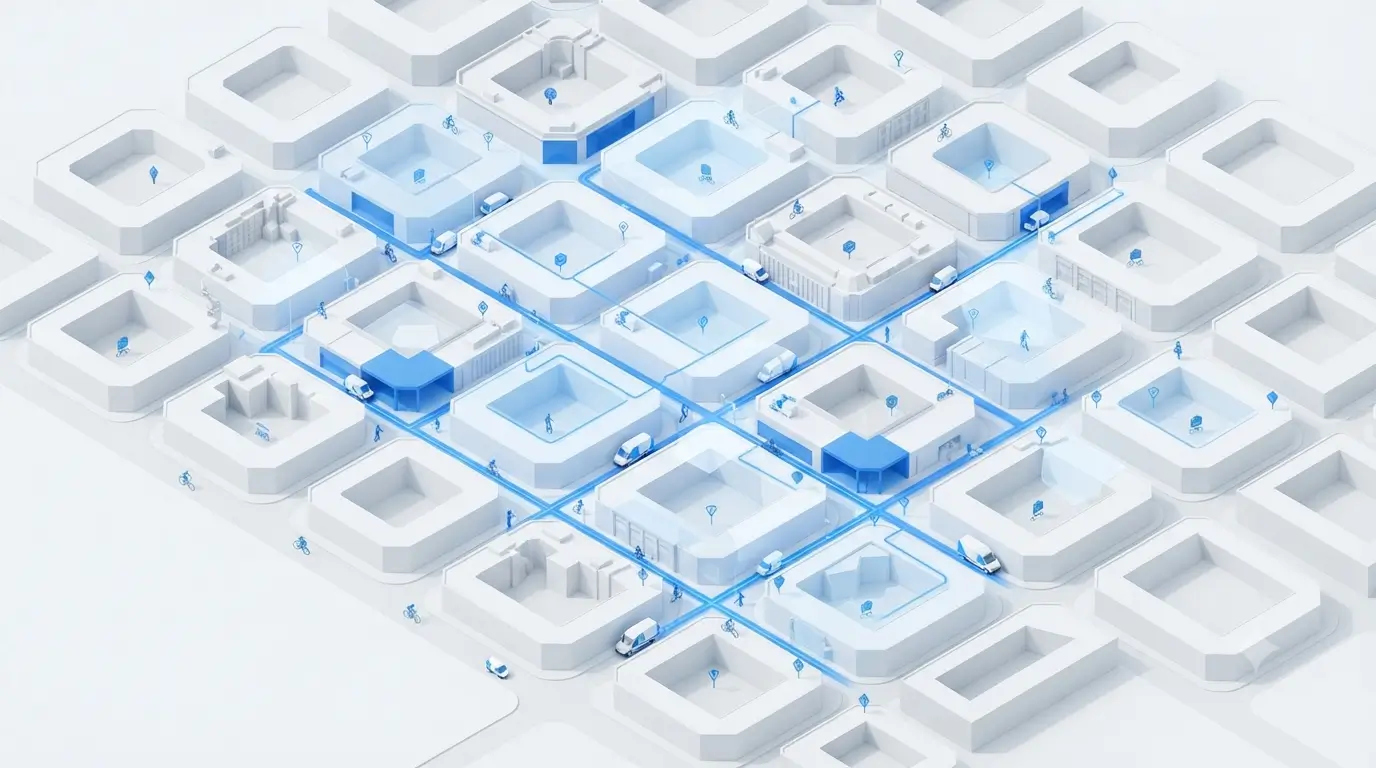
Urban mobility leaves a trace in the data. We analyse that trace to understand how people really move through the territory: what journeys they make, when, and with what patterns.
Urban mobility analysis with data studies real movement patterns across the territory using observable sources: origin-destination matrices, aggregated telecom data, public transport records, floating and tourist population presence. It measures the 15-minute city, sizes transport demand, understands commercial and tourist flows and detects service gaps.
unica360 carries out this analysis with proprietary microterritorial data for administrations, transport operators and companies with territorial decisions across Europe and LATAM.
We work with the real traces of mobility that human activity leaves across the territory:
origin-destination matrices from available data
tourist flow analysis for seasonal planning
15-minute city studies to measure real accessibility to services
public transport demand analysis and coverage gaps
Analyses draw on microtarget's mobility indicators: foot traffic, vehicle traffic, floating working population and tourism at street-segment level.
Applications

15-minute city
We measure real accessibility to facilities, transport and services for every area of the territory, based on actually installed supply.

Public transport
We identify served and unserved demand. Coverage gaps and network improvement opportunities.

Tourist flow analysis
We model tourist presence and movement for seasonal planning and flow management.

Territorial analysis for retail
Foot and vehicle traffic patterns by street segment for commercial decisions.

Smart city
Real mobility indicator dashboard for administrations that want to understand their territory before intervening in it.
Relationship with mobility simulation
This page covers analysis of what's already happening. If your project needs to predict what would happen with an urban intervention (pedestrianisation, superblock, new facility, digital twin), the mobility simulation line builds agent-based models to answer that question.

Public sector references
We've developed mobility analysis projects for the Ministry of Transport and Sustainable Mobility (MITMA), the Canary Islands Statistics Institute (ISTAC), Segittur and Mexican administrations, among others.



FAQ
Want to understand how your territory moves?
Tell us the challenge. A first assessment, no commitment.